A GRAPHICAL METHOD FOR CALCULATING PSEUDOCOLOR HOLOGRAM RECORDING GEOMETRIES
New Light Industries, Ltd.
ABSTRACT
A procedure is described that allows easy graphical computation of correct recording geometries for pseudocolor holograms from the desired display geometry. This procedure is based on the existence of a "hinge point" which is the zero spatial frequency locus of a hologram, and on the chromatic properties of diffraction gratings. While it avoids all of the mathematics normally associated with such computations, it is exactly equivalent to the mathematical method. A key advantage of the procedure is that it directly generates a diagram of the necessary recording setup.
Introduction:
Artists in holography frequently want to produce images in multiple colors. Steve Benton first demonstrated a method of recording multiple images that appear in different colors when viewed from a fixed position. Shortly thereafter variations on the technique were being used by several art holographers, notably Rudie Berkhout, Dan Schweitzer, Sam Moree, and Randy James. These techniques all produce what may be called pseudocolor Benton holograms: transmission-type holograms without vertical parallax.
Another technique has recently been employed by John Kaufman and Lon Moore which does not discard vertical parallax: pseudocolor reflection holography. This reflection technique grew out of the observation that controlling emulsion thickness before exposure allows control of the final image color in a reflection hologram. It was ultimately refined by incorporating the geometric methods developed by the author, allowing all color components to be reconstructed correctly by a single white light source.
Both pseudocolor Benton holograms and pseudocolor reflection holograms are normally made using only the red line from a Helium-Neon laser and are reconstructed with a white light. To compensate for distortions due to recording an image component in one color and viewing it in another color, it is necessary to use precisely controlled recording geometries.
This paper describes a simple graphical procedure developed by the author for designing optimum recording setups in pseudo-color holography. The procedure controls image color and simultaneously corrects for depth distortions due to wavelength shifts between recording and reconstruction.
About the Author:
Steve McGrew is president and founder of Light Impressions, Inc., in Santa Clara, CA. The company provides a hologram mass production service using a low cost embossing method, and also provides consulting and R & D services in display and technical holography. McGrew spends much of his free time hunting fossils with his associates.
Editor's Note: The author was an expectant father during the time of the Symposium. His papers were presented by John Kaufman.
Benton Holograms-Multiple Strip Method
A standard recording setup for pseudocolor Benton holograms is shown in Figure 1:
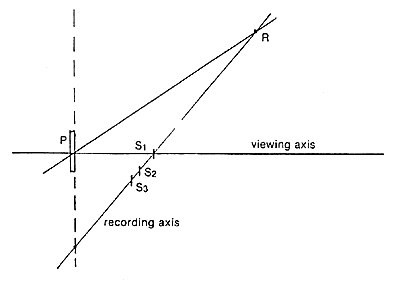
Figure 1. Multiple Strip Method
In the setup of figure 1, a single reference source located at R illuminates the holographic plate P, while images recorded in strip holograms S1, S2, and S3 are projected onto the plate. These strip holograms are in different positions corresponding to the color their images are meant to be viewed in. In Figure 1, S1 provides the red image component; and S3 provides the blue component. Both the reference-to-object angles and the plate-to-strip distances must be controlled in order to get correct and uniform colors.
Benton Holograms-Multiple Reference Method
Figure 2 illustrates an alternate setup in which each color component is recorded in a separate exposure.
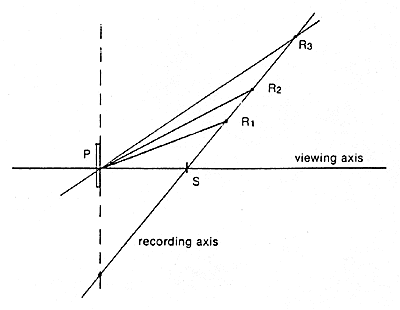
Figure 2. Multiple Reference Method
In the setup of Figure 2, the strip holograms are placed at S, one at a time. When S1 is in place, an exposure is made using a reference source at R1. Then S1 is removed and S2 is inserted, and an exposure is made using a reference source at R2, and so on.
Reflection Holograms
To make pseudocolor reflection holograms, the recording plate is swollen in triethanolamine solution before each exposure, so that the emulsion thickness at each exposure is inversely related to the wavelength at which that particular image component is to be viewed. The recording geometry shown in Figure 3 is used.
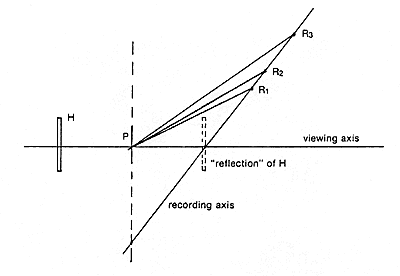
Figure 3. Pseudocolor Reflection Holograms
The "reflection" of H shown in figure 3 is an imaginary plate the same distance from the recording plate (P) as the actual H, but on the opposite side. Note that the "reflection" of H is in line with the reference source positions R1, R2, and R3.
In the setup of figure 3, multiple exposures are made using different reference source positions. As in the multiple reference method for Benton holograms, the plates bearing the various image components are placed, one at a time, in the same position (H) to project their images onto the recording plate P. The red component is recorded first using a reference source at R1, then the green using a reference source at R2, and so on.
The Hinge Point
The three setups shown in Figures 1, 2, and 3 have much in common. The most striking fact is that in all of them the reference source or sources and the object sources all lie on a straight line (the recording axis) . If that line is extended far enough it will intersect the plane in which the recording plate lies. That point of intersection may be called the "hinge point," and it can be used to determine the exact geometry required to obtain any desired colors and display geometry.
The hinge point is determined by the desired display geometry. Figure 4 portrays the example of a Benton hologram lit from above with a point white light source at a certain distance, and the viewer at a certain distance in front of the hologram. The illumination axis is the line drawn from the intended position of the illumination source through the center of the hologram. The hinge point is at the intersection of the plane the hologram is in, with the line drawn between the eye of the viewer and the white light source.
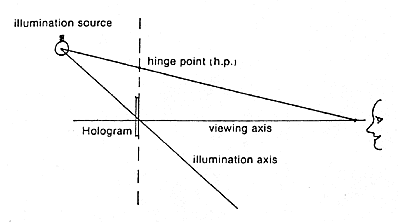
Figure 4. Locating the hinge point and illumination axis.
To record a hologram that can be displayed as in Figure 4, the multiple strip setup of Figure 5 may be used. A place for S1 is chosen on the viewing axis, then the recording axis is drawn through h.p. and S1. Where the recording axis intersects the illumination axis is the correct location (R) for the reference source.
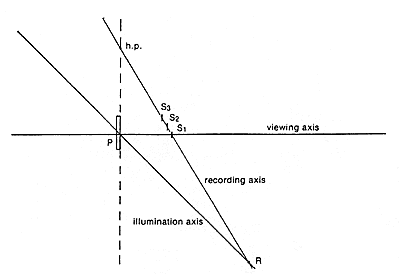
Figure 5. Using hinge point and illumination axis to design recording setup (multiple slit).
An alternate multiple reference setup to make the hologram of Figure 4 is shown in Figure 6. Here the position of the strips (S) on the viewing axis is chosen first. The recording axis is then drawn through h.p. and S. The intersection of the recording axis and the illumination axis is the correct location for R1, the reference source for the red component.
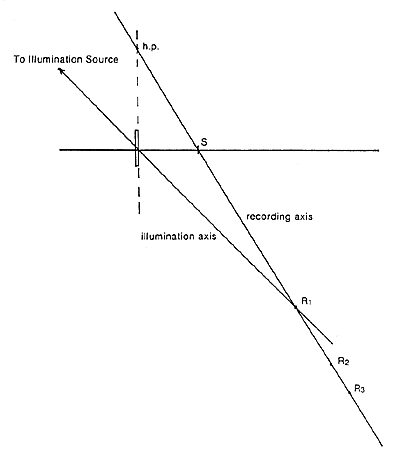
Figure 6. Using hinge point and illumination axis to design recording setup (multiple reference).
In figure 7, the hinge point is found by drawing a line from the imaginary "reflected" illumination source position to the position of the observer, and finding the intersection at the hologram plane. A reflection hologram to be displayed as in Figure 7 should be recorded as in Figure 8. The color component holograms are placed at H. The reference sources are placed on the recording axis which is a line drawn from the hinge point through the "reflection" of H. The reference source for the red component goes at R1, the intersection of the illumination axis with the recording axis.
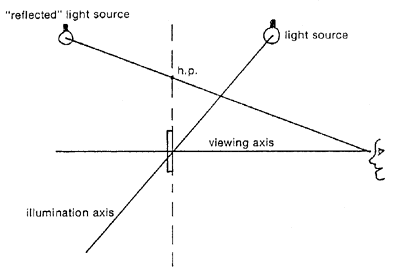
Figure 7. Locating the hinge point for a reflection hologram.
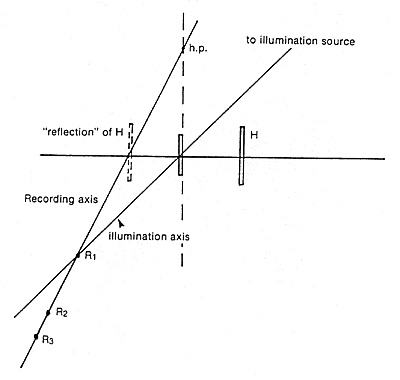
Figure 8. Using hinge point and illumination axis to design recording setup (reflection hologram).
In each of the cases illustrated, the hinge point is found first, and is used to locate the line along which the reference sources and the H-plates or strips are to be positioned (the recording axis). Also, the intersection of the recording axis and the illumination axis in each case locates the correct position of the reference source for the red component; and the strip (or H-plate) for the red component is on the viewing axis.
Object to Reference Angles
The reference sources and the strips (or the H-plates) are always positioned along the recording axis. Their placement is chosen so that the angle formed between a reference beam and an object beam (from an H-plate or a strip hologram) at the recording plate corresponds correctly to the color that is desired for the image component in that H-plate or strip hologram. There are equations that can be solved to find the angles, but there is also a graphical method that not only finds the angles but at the same time produces a drawing of the correct setup. Figures 9 and 10 illustrate the graphical method:
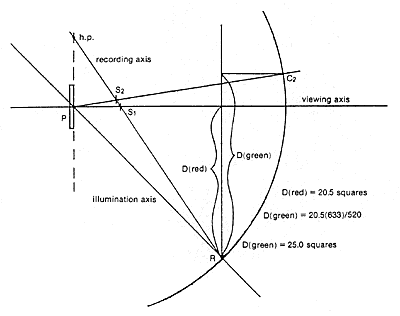
Figure 9. Finding the correct position of the strip to record a green image component (multiple strip setup).
In the multiple strip setup of Figure 9, an image component recorded in P with S1 and R positioned as shown will appear red to the viewer at V, with the red corresponding to the recording laser wavelength of 633 nanometers. Wavelength ranges corresponding to various colors are given in Chart 1:
| Color | Wavelength (nm) |
Red |
700 to 620 |
Orange |
620 to 580 |
Yellow |
570 to 580 |
Green |
487 to 570 |
Blue |
400 to 487 |
To find the correct position for S2 to obtain a color of, say, green at 520 nm, we must first locate the hinge point and the point R as we did in Figure 4. In figure 9, we draw a line from R perpendicular to the viewing axis. Measure that distance and call it D( red). Multiply that by the ratio of the red wavelength to the green wavelength to get D(green):
| D(green) = D(red) x 633/520 |
Next, measure from R along the line we drew, to a distance equal to D(green). From there draw a line parallel to the viewing axis until it intersects a circle which passes through R and is centered at the middle of the recording plate P. That point of intersection is labeled C2. From C2 draw a straight line back to the middle of the recording plate. Where that line intersects the recording axis is the correct position for the green component strip(S2).
The same procedure can be used to find the correct position for a strip hologram to obtain any desired color, just by substituting that wavelength into the relation. For example:
| D(blue) = D(red) x 633/(blue wavelength) |
For the multiple reference setup, a similar graphical method is used, shown in Fiqure 10.
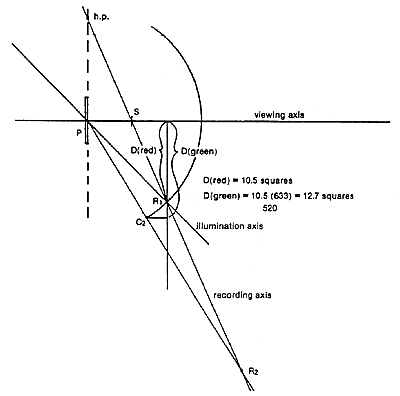
Figure 10. Finding the correct reference source position to record a green image component (multiple reference setup)
In this case, the same sort of diagram is drawn, except that D(green) is measured out from the viewing axis. A line is drawn parallel to the viewing axis from there over to the circle through Rl. The intersection is labeled C2. A line from the center of the plate through C2 is continued until it intersects the recording axis; and that intersection point is R2, the correct position for the reference source for the green image component.
For a reflection hologram, a similar diagram is used, shown in Figure 11.
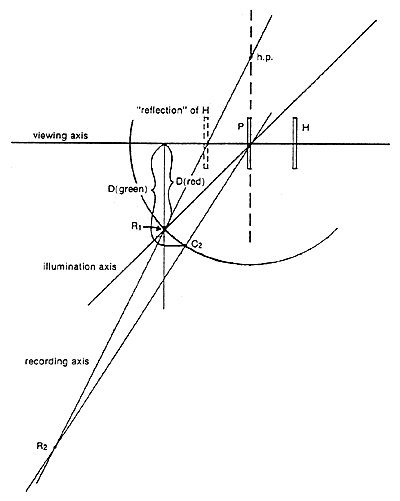
Figure 11. Finding reference source position for green component of a reflection hologram.
The only thing undetermined in the preceding discussions is where on the viewing axis to put the strip hologram S (or S1) or the H-plate in the first place. The position of the strip hologram whose image is to appear red determines the orientation of the recording axis and consequently determines the position of R or R1.
As it turns out, the position of S1, S or H is fairly arbitrary. If it is too far away from the recording plate, the reference source or sources will have to be an excessively long distance from the plate so normally S1, S, or H is as close as practical--12 to18 inches.
The original choice of display geometry strongly affects the recording setup, and generally it is easier to fit the required setup onto an isolation table if the distance to the illumination source is chosen to be as far as possible. That moves the hinge point farther from the recording plate and steepens the recording axis enough to keep the reference sources reasonably close to the recording plate.
The setups described here have many possible variations with their own advantages and disadvantages. All of them, however, can be analyzed in terms of a "hinge point" and angles found by the graphical procedures introduced here. The graphical procedure is really a computation technique that accurately connects recording geometry and wavelength to reconstruction geometry and wavelength.
The graphical method of finding object-to-reference angles derives from the behavior of a simple diffraction grating, illustrated in Figure 12.
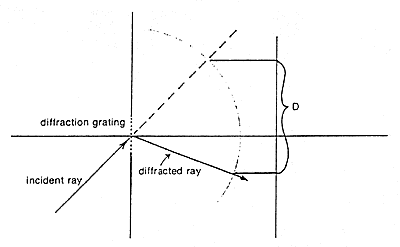
Figure 12. Behavior of a simple diffraction grating.
For a grating of a particular line spacing, distance D is proportional to the wavelength of the diffracted light and is the same regardless of the angle of incidence of the incident ray. The mathematical equation used to describe light diffraction by a grating is merely a mathematical description of the diagram: a mathematical assertion that D is independent of the angle of incidence and proportional to the wavelength of the diffracted light.
The hinge point corresponds to a point where, if the recording plate were large enough to include it, the spatial frequency of the hologram at that point would be zero. This is true even in the case of a reflection hologram, because at the hinge point in a reflection hologram the recorded fringes are parallel to the surface of the recording plate. This fact becomes clear when one sees (in reference to figures 1, 2, and 3) that at the hinge point the reference and object sources are in-line.
A simple analogy to a Benton hologram is the holographic lens diagrammed in figure 13. The key feature of the behavior of the lens is that the spectrum focused by the lens when it is illuminated by a point source forms a line that points straight back at the point source. The whole technique of geometric color control can be derived from the principles shown in figures 12 and 13. This method works very well for almost all needs of the art holographer, and is useful for the technical holographer who needs a quick first-order analysis of a hologram. Refinements of the method can even account for spherical aberrations.
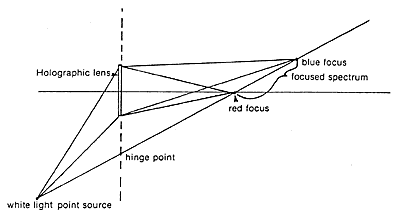
Figure 13. Chromatic behavior of a holographic lens.
By careful use of diagrams that use the hinge point and the behavior of gratings, the properties of display holograms can be predicted from the recording setups and most importantly, the setup required to obtain a hologram with particular properties can be deduced directly from the display geometry.
Summary:
A procedure has been described that allows easy graphical computation of correct recording geometries for pseudocolor holograms from the desired display geometry. The procedure is based on the existence of a "hinge point" which is the zero spatial frequency locus of a hologram, and on the properties of a diffraction grating. While it avoids all of the mathematics normally associated with such computations, it is exactly equivalent to the mathematical method. The greatest advantage of the procedure is that it directly generates a drawing of the necessary recording setup.


